Largest-Companies-By-Revenue
100 Largest Companies by Revenue in the United States for 2022
Python Flask-powered API, HTML/CSS, JavaScript, Leaflet, Plotly
Jupyter notebook “exploration.ipynb” file reads, cleans, and uploads 2 files:
100 rows of company data from “data/largest_us_companies_2022.csv”</br> Source: Wikipedia - https://en.wikipedia.org/wiki/List_of_largest_companies_in_the_United_States_by_revenue
21,586 rows of historical stock data from “data/stock_prices_2022.csv”</br> Source: Yahoo! Finance - https://finance.yahoo.com/lookup
Two csv files are read into Python DataFrames. Data is cleaned by updating column names, splitting geo coordinates into separate latitude and longitude columns, and removing commas from integer fields. After creating the new tables in PostgreSQL, SQLAlchemy is used to upload the cleaned data into the two new tables.
“app.py” creates multiple Python Flask-powered APIs for retrieving the data locally from PostgreSQL.
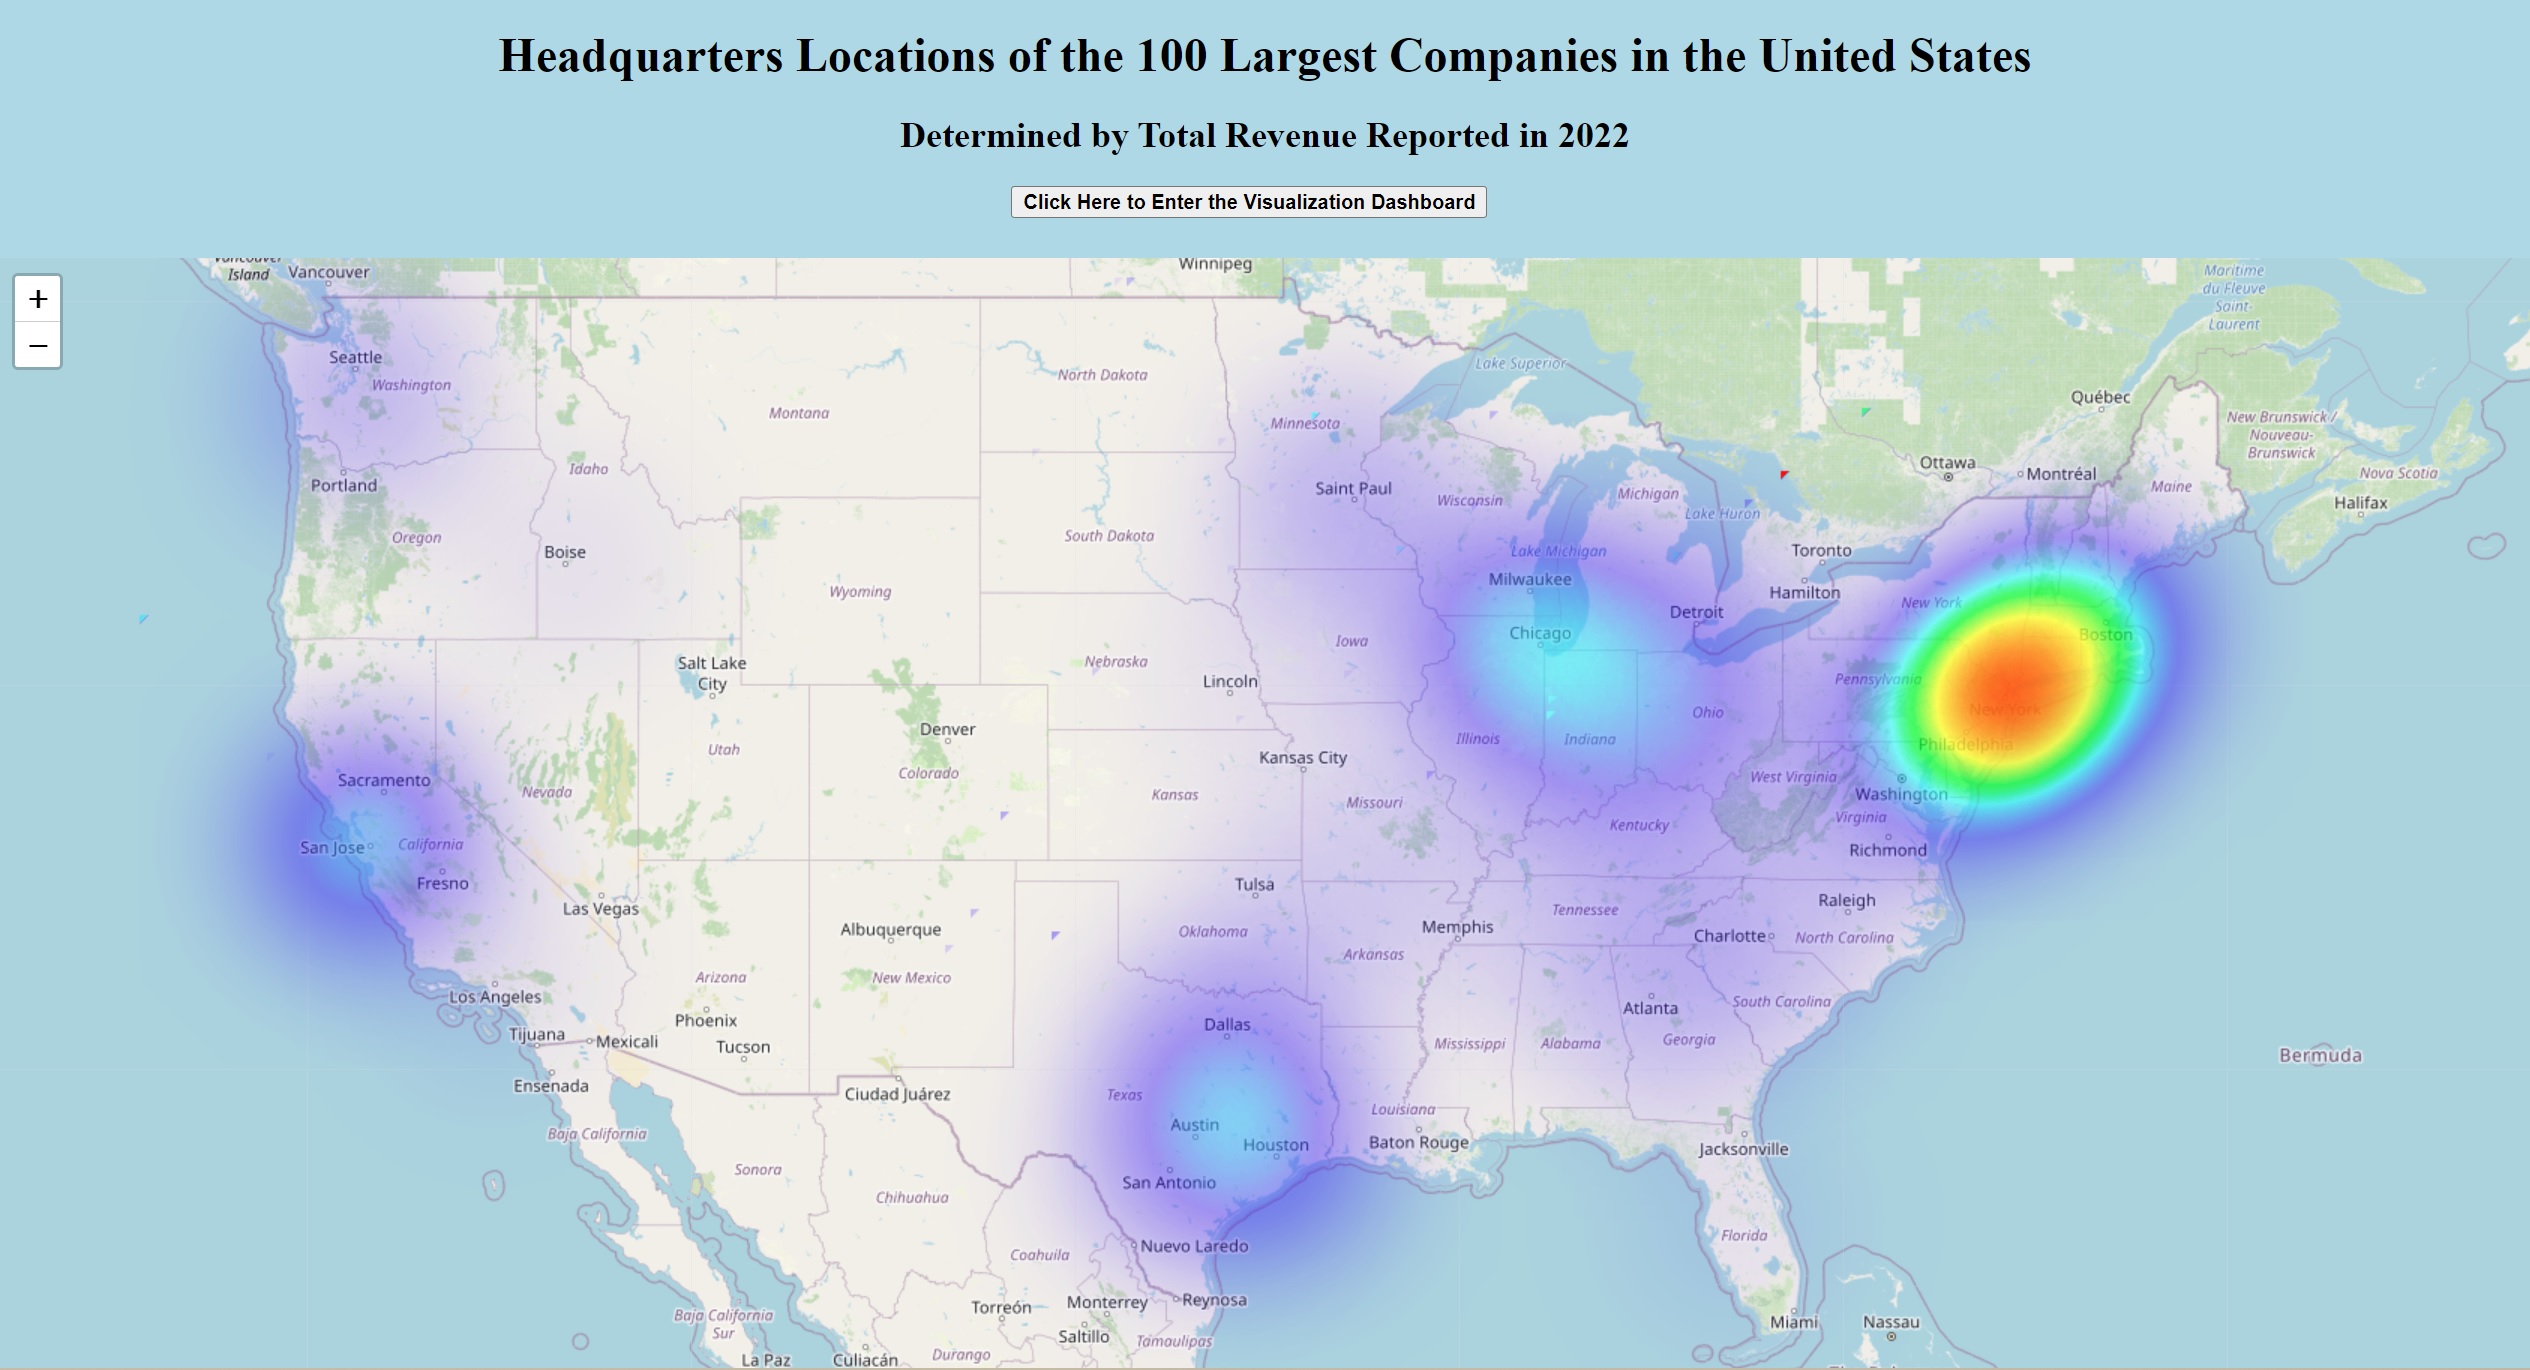
“templates/index.html” is the starting page, in which the headquarters for the top 100 companies by revenue in the United States are displayed in a Leaflet Heat Map visualization. This map also accesses “static/js/leaflet-heat.js” and “static/css/style.css”. The user can zoom and scroll this map, or interact with a button to load the additional page.
“templates/dashboard.html” renders the additional page, which contains two additional visualizations. The first is a Plotly bar chart showing the 2022 average revenue per industry.
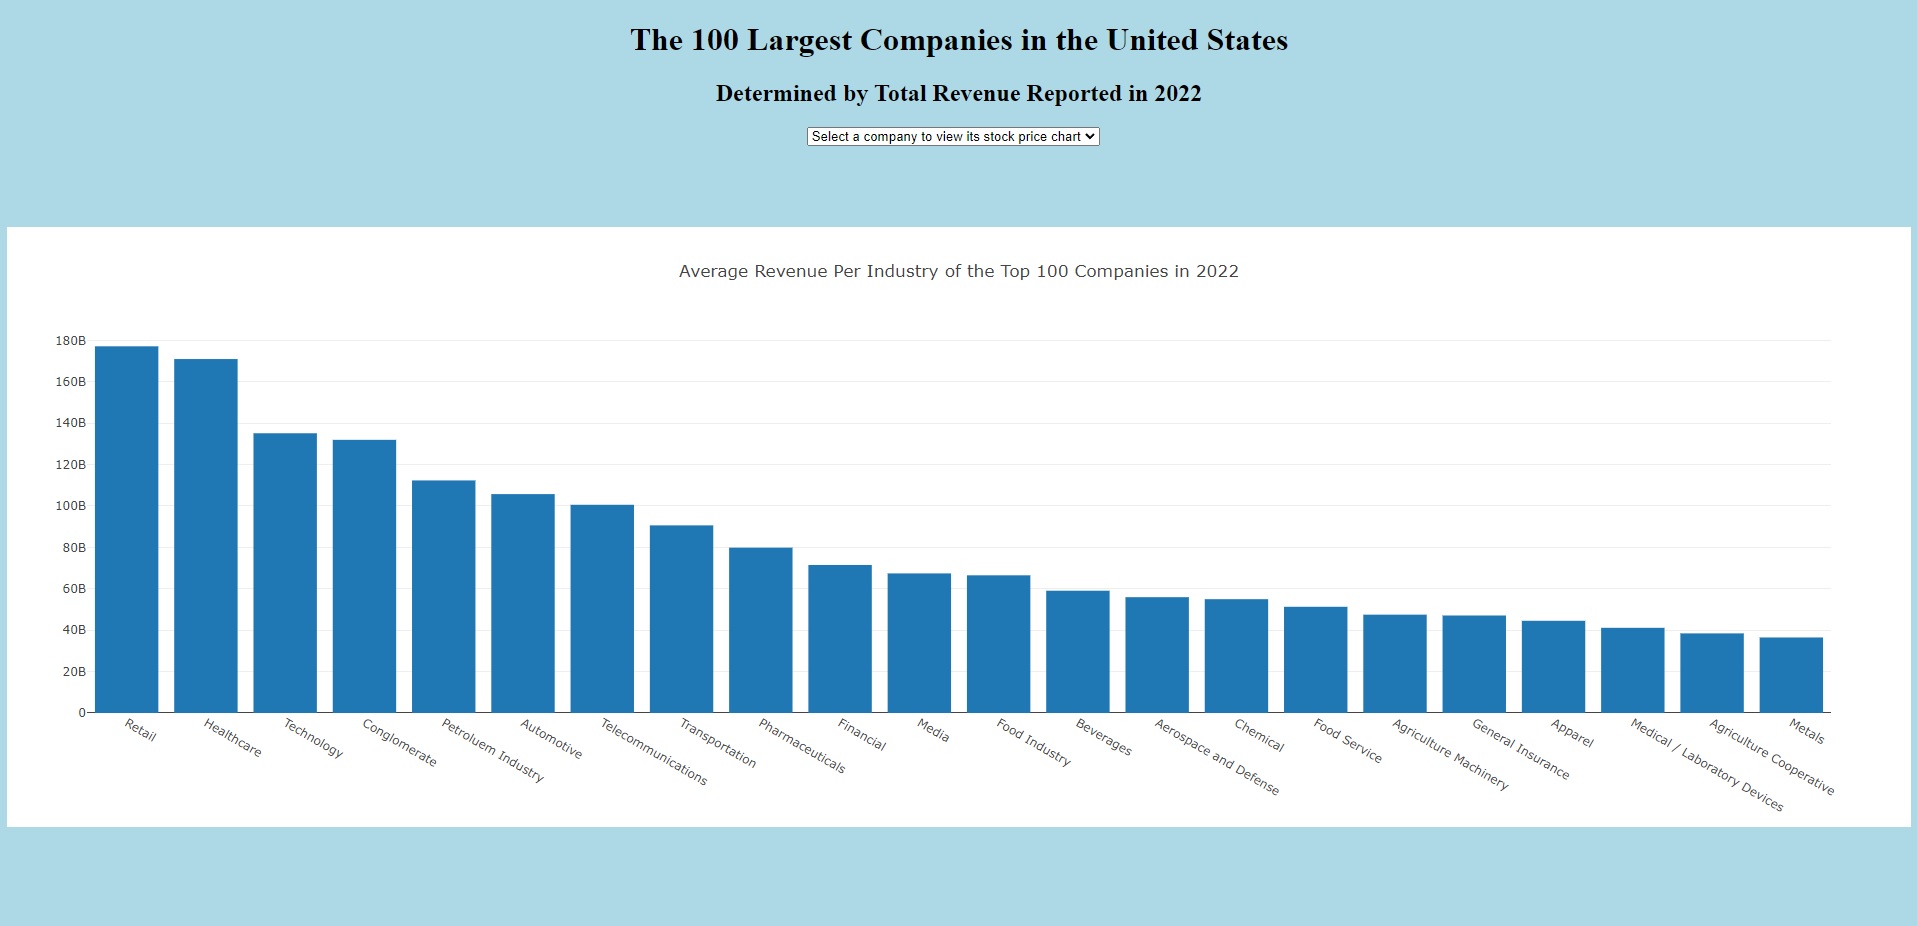
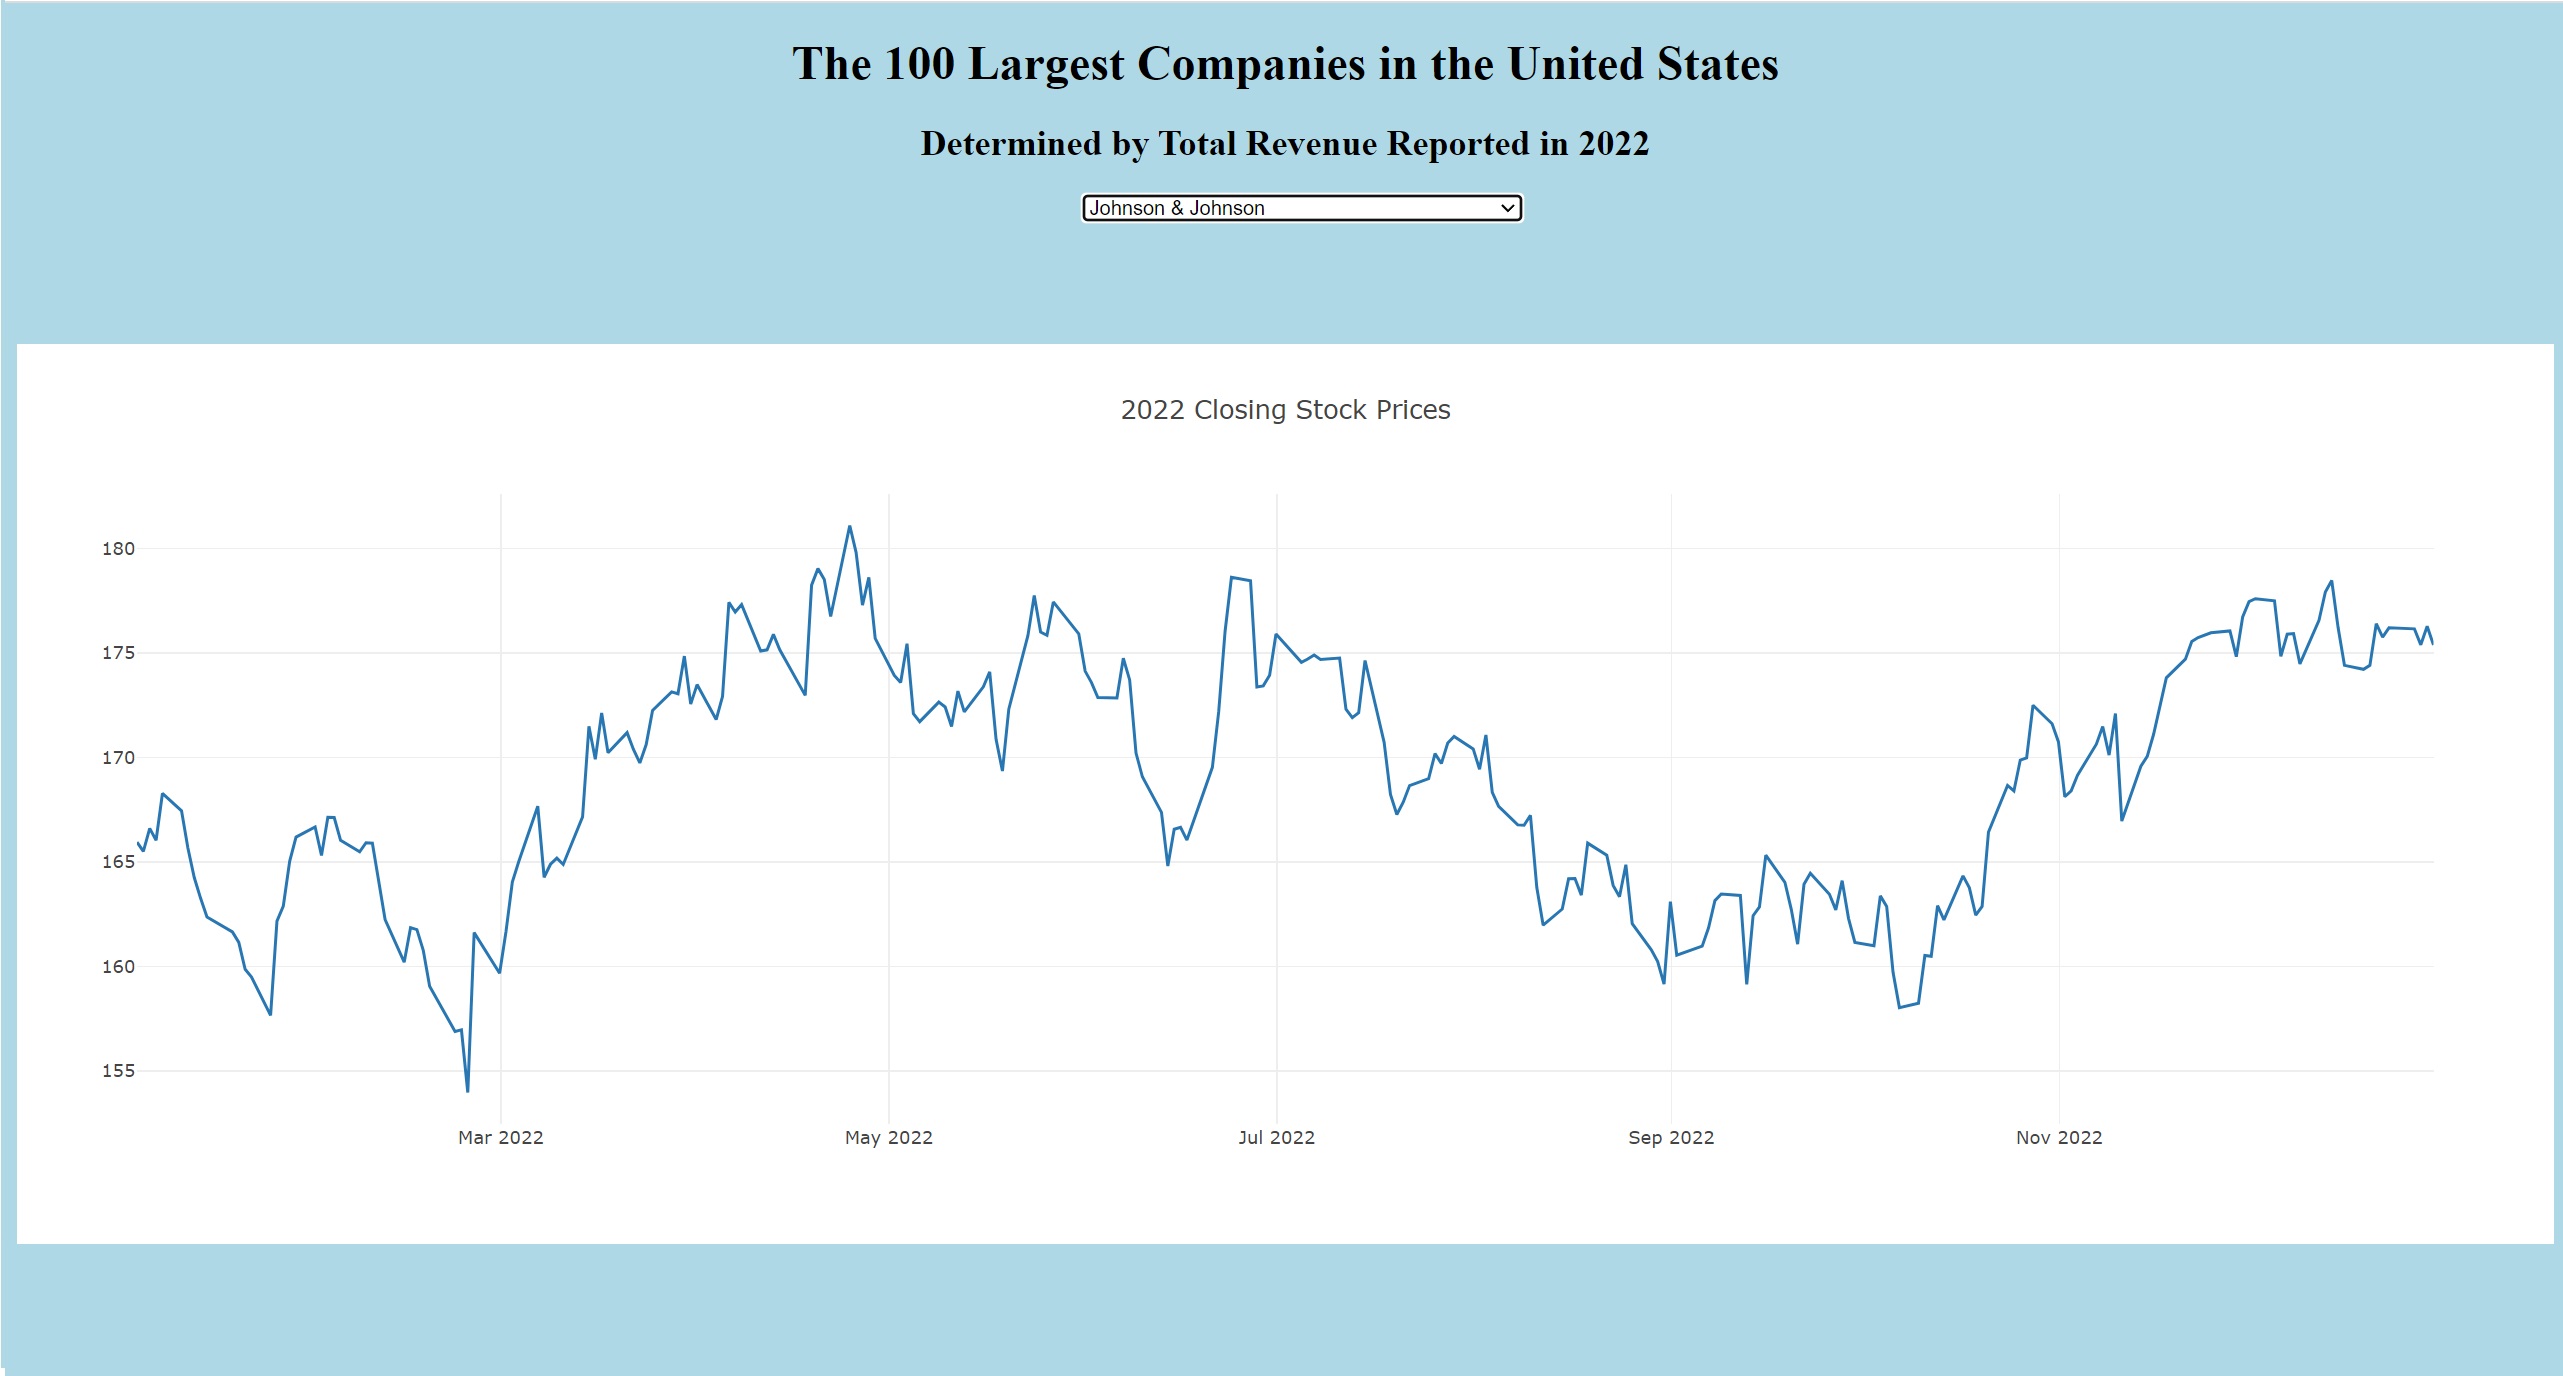
The user can also interact by selecting a company from a dropdown, which will filter the 2022 stock price data for that company abd display it via a Plotly line chart.